


QUICK ANSWER
The easiest way for a company with a few office buildings to track its carbon emissions is a tool that works them out from the energy records you already receive. You list each building's electricity, gas heating, AC refrigerant and generator diesel once, then type in monthly quantities. GHG Metric suits facility teams new to carbon reporting while keeping every calculation GHG Protocol-aligned.
01
Add each building you operate and select electricity, heating, air conditioning and standby generators.
02
Type monthly kWh, m³ of gas, kg of refrigerant topped up and liters of generator diesel.
03
Factors for each fuel and your country's grid are applied, with results split into Scope 1 and 2.
04
Review the ranking and act first on the building system with the largest share.
01
Add your buildings
Create each office, retail unit or mixed-use building you operate as a facility. Start with one address and add the rest of the portfolio later.
02
Choose what each building uses
Select what applies: refrigeration equipment for chillers and AC units, electricity and natural gas, heating oil or LPG, and diesel for standby generators or pool cars.
03
Name meters, boilers and AC systems once
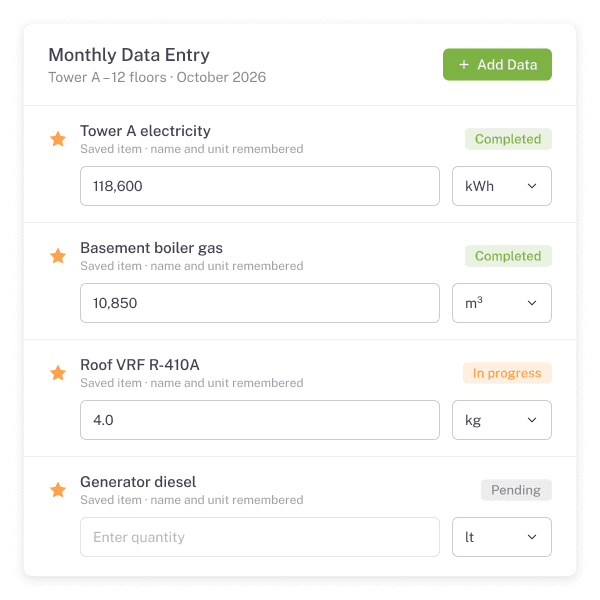
Create items like "Tower A electricity" in kWh, "Basement boiler gas" in m³ or "Roof VRF R-410A" in kg, and star each one to reuse.
04
Enter the month, compare buildings
Type quantities from bills and contractor reports. Results per building, the portfolio total and the ranking of largest activities refresh on save.
Build every building's inventory card by card: electricity for lighting, lifts, IT and air handling, natural gas or heating oil for boilers, refrigerant added to chillers, VRF and split systems, and diesel for emergency generator test runs. You name equipment the way your facility team does. GHG Metric picks the factor for each fuel, refrigerant and country grid, then allocates the scope.

Describe Plant Rooms in Plain Terms
AC Refrigerant Leaks Included
Generator Test Runs Captured


" width="81.25px"><path d="M 0 9.375 L 25 0 L 53.125 9.375 L 81.25 0 L 81.25 62.5 L 53.125 71.875 L 25 62.5 L 0 71.875 Z" fill="rgb(233, 237, 201)" height="71.875px" id="vSCZD949O" stroke-dasharray="" stroke-linecap="round" stroke-linejoin="round" stroke-width="3.44" stroke="rgb(31, 36, 33)" width="81.25px"/><path d="M 0 0 L 0 62.5 M 28.125 9.375 L 28.125 71.875" fill="transparent" height="71.875px" id="lXTzcQBES" stroke-dasharray="" stroke-linecap="round" stroke-linejoin="round" stroke-width="3.44" stroke="rgb(31, 36, 33)" transform="translate(25 0)" width="28.125px"/><path d="M 13.281 35.156 C 13.281 35.156 0 21.875 0 13.281 C 0 9.759 1.399 6.381 3.89 3.89 C 6.381 1.399 9.759 0 13.281 0 C 16.804 0 20.182 1.399 22.672 3.89 C 25.163 6.381 26.563 9.759 26.563 13.281 C 26.563 21.875 13.281 35.156 13.281 35.156 Z" fill="rgb(182, 194, 74)" height="35.15625px" id="yY3Oq8kmu" stroke-dasharray="" stroke-linecap="round" stroke-linejoin="round" stroke-width="3.44" stroke="rgb(31, 36, 33)" transform="translate(11.719 8.594)" width="26.5625px"/><path d="M 4.688 9.375 C 7.276 9.375 9.375 7.276 9.375 4.688 C 9.375 2.099 7.276 0 4.688 0 C 2.099 0 0 2.099 0 4.688 C 0 7.276 2.099 9.375 4.688 9.375 Z" fill="rgb(255, 255, 255)" height="9.375px" id="y9n93J6_D" stroke-dasharray="" stroke-linecap="round" stroke-linejoin="round" stroke-width="3.44" stroke="rgb(31, 36, 33)" transform="translate(20.313 17.188)" width="9.375px"/><path d="M 10.938 28.906 C 10.938 28.906 0 17.969 0 10.938 C 0 8.037 1.152 5.255 3.204 3.204 C 5.255 1.152 8.037 0 10.938 0 C 13.838 0 16.62 1.152 18.671 3.204 C 20.723 5.255 21.875 8.037 21.875 10.938 C 21.875 17.969 10.938 28.906 10.938 28.906 Z" fill="rgb(255, 255, 255)" height="28.90625px" id="sDOsahOwu" stroke-dasharray="" stroke-linecap="round" stroke-linejoin="round" stroke-width="3.44" stroke="rgb(31, 36, 33)" transform="translate(48.438 24.219)" width="21.875px"/><path d="M 3.75 7.5 C 5.821 7.5 7.5 5.821 7.5 3.75 C 7.5 1.679 5.821 0 3.75 0 C 1.679 0 0 1.679 0 3.75 C 0 5.821 1.679 7.5 3.75 7.5 Z" fill="rgb(182, 194, 74)" height="7.5px" id="y2KnbfKez" stroke-dasharray="" stroke-linecap="round" stroke-linejoin="round" stroke-width="3.44" stroke="rgb(31, 36, 33)" transform="translate(55.625 31.406)" width="7.49999999999973px"/></g></svg>)
Add every office, retail unit or mixed-use building and see results per address and for the portfolio.
" width="78.125px"><path d="M 10.938 0 L 0 23.438 M 14.063 0 L 25 23.438" fill="transparent" height="23.4375px" id="d8hM_8Qvd" stroke-dasharray="" stroke-linecap="round" stroke-linejoin="round" stroke-width="3.44" stroke="rgb(31, 36, 33)" transform="translate(26.563 53.125)" width="25px"/><path d="M 74.219 0 L 3.906 0 C 1.749 0 0 1.749 0 3.906 L 0 49.219 C 0 51.376 1.749 53.125 3.906 53.125 L 74.219 53.125 C 76.376 53.125 78.125 51.376 78.125 49.219 L 78.125 3.906 C 78.125 1.749 76.376 0 74.219 0 Z" fill="rgb(255, 255, 255)" height="53.125px" id="b15pfSmVJ" stroke-dasharray="" stroke-linecap="round" stroke-linejoin="round" stroke-width="3.44" stroke="rgb(31, 36, 33)" width="78.125px"/><path d="M 0 0 L 78.125 0" fill="transparent" height="1px" id="FFAkwVJUK" stroke-dasharray="" stroke-linecap="round" stroke-linejoin="round" stroke-width="3.44" stroke="rgb(31, 36, 33)" transform="translate(0 9.375)" width="78.125px"/><path d="M 7.813 0 L 0 0 L 0 15.625 L 7.813 15.625 Z" fill="rgb(182, 194, 74)" height="15.625px" id="EPBteug7h" stroke-dasharray="" stroke-linecap="round" stroke-linejoin="round" stroke-width="3.44" stroke="rgb(31, 36, 33)" transform="translate(10.938 29.688)" width="7.8125px"/><path d="M 7.813 0 L 0 0 L 0 25 L 7.813 25 Z" fill="rgb(182, 194, 74)" height="25px" id="fi8qSKkjx" stroke-dasharray="" stroke-linecap="round" stroke-linejoin="round" stroke-width="3.44" stroke="rgb(31, 36, 33)" transform="translate(23.438 20.313)" width="7.8125px"/><path d="M 7.813 0 L 0 0 L 0 20.313 L 7.813 20.313 Z" fill="rgb(233, 237, 201)" height="20.3125px" id="jRwaHT4bY" stroke-dasharray="" stroke-linecap="round" stroke-linejoin="round" stroke-width="3.44" stroke="rgb(31, 36, 33)" transform="translate(35.938 25)" width="7.8125px"/><path d="M 11.719 23.438 C 18.191 23.438 23.438 18.191 23.438 11.719 C 23.438 5.247 18.191 0 11.719 0 C 5.247 0 0 5.247 0 11.719 C 0 18.191 5.247 23.438 11.719 23.438 Z" fill="rgb(233, 237, 201)" height="23.4375px" id="F35cvS0QV" stroke-dasharray="" stroke-linecap="round" stroke-linejoin="round" stroke-width="3.44" stroke="rgb(31, 36, 33)" transform="translate(47.656 22.656)" width="23.4375px"/><path d="M 0 0 L 8.594 8.594" fill="transparent" height="8.59375px" id="D_Yi3CT3V" stroke-dasharray="" stroke-linecap="round" stroke-linejoin="round" stroke-width="3.44" stroke="rgb(31, 36, 33)" transform="translate(67.969 42.969)" width="8.59375px"/><path d="M 0 3.125 L 3.125 6.25 L 9.375 0" fill="transparent" height="6.25px" id="aogc524Gq" stroke-dasharray="" stroke-linecap="round" stroke-linejoin="round" stroke-width="3.44" stroke="rgb(31, 36, 33)" transform="translate(54.688 31.25)" width="9.375px"/></g></svg>)
Scope 1 and 2 for each building in one monthly chart, ready for investor surveys.
" width="82.8125px"><path d="M 32.813 65.625 C 50.934 65.625 65.625 50.934 65.625 32.813 C 65.625 14.691 50.934 0 32.813 0 C 14.691 0 0 14.691 0 32.813 C 0 50.934 14.691 65.625 32.813 65.625 Z" fill="rgb(255, 255, 255)" height="65.625px" id="xeBB4d1Gb" stroke-dasharray="" stroke-linecap="round" stroke-linejoin="round" stroke-width="3.44" stroke="rgb(31, 36, 33)" transform="translate(0 17.188)" width="65.625px"/><path d="M 21.875 43.75 C 33.956 43.75 43.75 33.956 43.75 21.875 C 43.75 9.794 33.956 0 21.875 0 C 9.794 0 0 9.794 0 21.875 C 0 33.956 9.794 43.75 21.875 43.75 Z" fill="rgb(182, 194, 74)" height="43.75px" id="mtshUSx75" stroke-dasharray="" stroke-linecap="round" stroke-linejoin="round" stroke-width="3.44" stroke="rgb(31, 36, 33)" transform="translate(10.938 28.125)" width="43.75px"/><path d="M 10.938 21.875 C 16.978 21.875 21.875 16.978 21.875 10.938 C 21.875 4.897 16.978 0 10.938 0 C 4.897 0 0 4.897 0 10.938 C 0 16.978 4.897 21.875 10.938 21.875 Z" fill="rgb(255, 255, 255)" height="21.875px" id="mL14m5PXF" stroke-dasharray="" stroke-linecap="round" stroke-linejoin="round" stroke-width="3.44" stroke="rgb(31, 36, 33)" transform="translate(21.875 39.063)" width="21.875px"/><path d="M 3.125 6.25 C 4.851 6.25 6.25 4.851 6.25 3.125 C 6.25 1.399 4.851 0 3.125 0 C 1.399 0 0 1.399 0 3.125 C 0 4.851 1.399 6.25 3.125 6.25 Z" fill="rgb(31, 36, 33)" height="6.25px" id="HxN2RQi1k" transform="translate(29.688 46.875)" width="6.25px"/><path d="M 0 34.375 L 34.375 0" fill="transparent" height="34.375px" id="iTd92BZ7t" stroke-dasharray="" stroke-linecap="round" stroke-linejoin="round" stroke-width="3.44" stroke="rgb(31, 36, 33)" transform="translate(32.813 15.625)" width="34.375px"/><path d="M 0 15.625 L 0 3.125 L 9.375 0 L 6.25 9.375 L 15.625 9.375 L 12.5 15.625 Z" fill="rgb(233, 237, 201)" height="15.625px" id="w79rFToGO" stroke-dasharray="" stroke-linecap="round" stroke-linejoin="round" stroke-width="3.44" stroke="rgb(31, 36, 33)" transform="translate(67.188 0)" width="15.625px"/></g></svg>)
Set a portfolio reduction target and follow monthly progress after each retrofit.
" width="87.5px"><path d="M 7.813 15.625 C 12.127 15.625 15.625 12.127 15.625 7.813 C 15.625 3.498 12.127 0 7.813 0 C 3.498 0 0 3.498 0 7.813 C 0 12.127 3.498 15.625 7.813 15.625 Z" fill="rgb(255, 255, 255)" height="15.625px" id="brxrqZ3T2" stroke-dasharray="" stroke-linecap="round" stroke-linejoin="round" stroke-width="3.44" stroke="rgb(31, 36, 33)" transform="translate(6.25 11.719)" width="15.625px"/><path d="M 0 10.547 C 0 -3.516 28.125 -3.516 28.125 10.547 Z" fill="rgb(255, 255, 255)" height="10.546875px" id="YKfXNhH0n" stroke-dasharray="" stroke-linecap="round" stroke-linejoin="round" stroke-width="3.44" stroke="rgb(31, 36, 33)" transform="translate(0 41.797)" width="28.125px"/><path d="M 7.813 15.625 C 12.127 15.625 15.625 12.127 15.625 7.813 C 15.625 3.498 12.127 0 7.813 0 C 3.498 0 0 3.498 0 7.813 C 0 12.127 3.498 15.625 7.813 15.625 Z" fill="rgb(255, 255, 255)" height="15.625px" id="c_XMbm3Tl" stroke-dasharray="" stroke-linecap="round" stroke-linejoin="round" stroke-width="3.44" stroke="rgb(31, 36, 33)" transform="translate(65.625 11.719)" width="15.625px"/><path d="M 0 10.547 C 0 -3.516 28.125 -3.516 28.125 10.547 Z" fill="rgb(255, 255, 255)" height="10.546875px" id="dRZK4YGgr" stroke-dasharray="" stroke-linecap="round" stroke-linejoin="round" stroke-width="3.44" stroke="rgb(31, 36, 33)" transform="translate(59.375 41.797)" width="28.125px"/><path d="M 11.719 23.438 C 18.191 23.438 23.438 18.191 23.438 11.719 C 23.438 5.247 18.191 0 11.719 0 C 5.247 0 0 5.247 0 11.719 C 0 18.191 5.247 23.438 11.719 23.438 Z" fill="rgb(182, 194, 74)" height="23.4375px" id="KcPEx6vmW" stroke-dasharray="" stroke-linecap="round" stroke-linejoin="round" stroke-width="3.44" stroke="rgb(31, 36, 33)" transform="translate(32.031 0)" width="23.4375px"/><path d="M 0 17.578 C 0 -5.859 43.75 -5.859 43.75 17.578 Z" fill="rgb(182, 194, 74)" height="17.578125px" id="teinitMbp" stroke-dasharray="" stroke-linecap="round" stroke-linejoin="round" stroke-width="3.44" stroke="rgb(31, 36, 33)" transform="translate(21.875 41.016)" width="43.75px"/></g></svg>)
Facility coordinators enter data for their own buildings with role-based access.
" width="67.1875px"><path d="M 48.438 0 L 4.688 0 C 2.099 0 0 2.099 0 4.688 L 0 70.313 C 0 72.901 2.099 75 4.688 75 L 48.438 75 C 51.026 75 53.125 72.901 53.125 70.313 L 53.125 4.688 C 53.125 2.099 51.026 0 48.438 0 Z" fill="rgb(255, 255, 255)" height="75px" id="y5hxB6X2h" stroke-dasharray="" stroke-linecap="round" stroke-linejoin="round" stroke-width="3.44" stroke="rgb(31, 36, 33)" width="53.125px"/><path d="M 7.813 0 L 1.563 0 C 0.7 0 0 0.7 0 1.563 L 0 7.813 C 0 8.675 0.7 9.375 1.563 9.375 L 7.813 9.375 C 8.675 9.375 9.375 8.675 9.375 7.813 L 9.375 1.563 C 9.375 0.7 8.675 0 7.813 0 Z" fill="rgb(182, 194, 74)" height="9.375px" id="RupO7lKF1" stroke-dasharray="" stroke-linecap="round" stroke-linejoin="round" stroke-width="3.44" stroke="rgb(31, 36, 33)" transform="translate(9.375 12.5)" width="9.375px"/><path d="M 0 0 L 17.188 0" fill="transparent" height="1px" id="P20hSjC8k" stroke-dasharray="" stroke-linecap="round" stroke-linejoin="round" stroke-width="3.44" stroke="rgb(31, 36, 33)" transform="translate(26.563 17.188)" width="17.1875px"/><path d="M 7.813 0 L 1.563 0 C 0.7 0 0 0.7 0 1.563 L 0 7.813 C 0 8.675 0.7 9.375 1.563 9.375 L 7.813 9.375 C 8.675 9.375 9.375 8.675 9.375 7.813 L 9.375 1.563 C 9.375 0.7 8.675 0 7.813 0 Z" fill="rgb(182, 194, 74)" height="9.375px" id="xTAFTlBf1" stroke-dasharray="" stroke-linecap="round" stroke-linejoin="round" stroke-width="3.44" stroke="rgb(31, 36, 33)" transform="translate(9.375 29.688)" width="9.375px"/><path d="M 0 0 L 17.188 0" fill="transparent" height="1px" id="WUTeDm5Oo" stroke-dasharray="" stroke-linecap="round" stroke-linejoin="round" stroke-width="3.44" stroke="rgb(31, 36, 33)" transform="translate(26.563 34.375)" width="17.1875px"/><path d="M 7.813 0 L 1.563 0 C 0.7 0 0 0.7 0 1.563 L 0 7.813 C 0 8.675 0.7 9.375 1.563 9.375 L 7.813 9.375 C 8.675 9.375 9.375 8.675 9.375 7.813 L 9.375 1.563 C 9.375 0.7 8.675 0 7.813 0 Z" fill="rgb(233, 237, 201)" height="9.375px" id="JRrWC58rl" stroke-dasharray="" stroke-linecap="round" stroke-linejoin="round" stroke-width="3.44" stroke="rgb(31, 36, 33)" transform="translate(9.375 46.875)" width="9.375px"/><path d="M 0 0 L 9.375 0" fill="transparent" height="1px" id="mXsqmo7HQ" stroke-dasharray="" stroke-linecap="round" stroke-linejoin="round" stroke-width="3.44" stroke="rgb(31, 36, 33)" transform="translate(26.563 51.563)" width="9.375px"/><path d="M 4.688 0 L 0 15.625 L 7.813 11.719 L 12.5 17.188 L 15.625 3.125" fill="rgb(233, 237, 201)" height="17.1875px" id="DrnswayXi" stroke-dasharray="" stroke-linecap="round" stroke-linejoin="round" stroke-width="3.44" stroke="rgb(31, 36, 33)" transform="translate(40.625 70.313)" width="15.625px"/><path d="M 7.813 0 L 12.5 15.625 L 4.688 11.719 L 0 17.188" fill="rgb(233, 237, 201)" height="17.1875px" id="evMmjs7h2" stroke-dasharray="" stroke-linecap="round" stroke-linejoin="round" stroke-width="3.44" stroke="rgb(31, 36, 33)" transform="translate(53.125 70.313)" width="12.5px"/><path d="M 14.063 28.125 C 21.829 28.125 28.125 21.829 28.125 14.063 C 28.125 6.296 21.829 0 14.063 0 C 6.296 0 0 6.296 0 14.063 C 0 21.829 6.296 28.125 14.063 28.125 Z" fill="rgb(182, 194, 74)" height="28.125px" id="BBxTX78kF" stroke-dasharray="" stroke-linecap="round" stroke-linejoin="round" stroke-width="3.44" stroke="rgb(31, 36, 33)" transform="translate(39.063 48.438)" width="28.125px"/><path d="M 0 3.906 L 3.906 7.813 L 10.938 0" fill="transparent" height="7.8125px" id="oyOVGjMH2" stroke-dasharray="" stroke-linecap="round" stroke-linejoin="round" stroke-width="3.44" stroke="rgb(31, 36, 33)" transform="translate(47.656 58.594)" width="10.9375px"/></g></svg>)
GHG Protocol-aligned factors for heating fuels, common refrigerants and country grids.
" width="84.375px"><path d="M 79.688 0 L 4.688 0 C 2.099 0 0 2.099 0 4.688 L 0 60.938 C 0 63.526 2.099 65.625 4.688 65.625 L 79.688 65.625 C 82.276 65.625 84.375 63.526 84.375 60.938 L 84.375 4.688 C 84.375 2.099 82.276 0 79.688 0 Z" fill="rgb(255, 255, 255)" height="65.625px" id="RXhyIcNiS" stroke-dasharray="" stroke-linecap="round" stroke-linejoin="round" stroke-width="3.44" stroke="rgb(31, 36, 33)" width="84.375px"/><path d="M 0 0 L 84.375 0" fill="transparent" height="1px" id="yfEzFetRq" stroke-dasharray="" stroke-linecap="round" stroke-linejoin="round" stroke-width="3.44" stroke="rgb(31, 36, 33)" transform="translate(0 14.063)" width="84.375px"/><path d="M 78.906 0 L 3.906 0 C 1.749 0 0 1.749 0 3.906 L 0 8.594 C 0 10.751 1.749 12.5 3.906 12.5 L 78.906 12.5 C 81.064 12.5 82.813 10.751 82.813 8.594 L 82.813 3.906 C 82.813 1.749 81.064 0 78.906 0 Z" fill="rgb(233, 237, 201)" height="12.5px" id="tbr6T5A1x" transform="translate(0.781 0.781)" width="82.8125px"/><path d="M 0 0 L 84.375 0" fill="transparent" height="1px" id="oR8ovSgA0" stroke-dasharray="" stroke-linecap="round" stroke-linejoin="round" stroke-width="3.44" stroke="rgb(31, 36, 33)" transform="translate(0 14.063)" width="84.375px"/><path d="M 2.5 5 C 3.881 5 5 3.881 5 2.5 C 5 1.119 3.881 0 2.5 0 C 1.119 0 0 1.119 0 2.5 C 0 3.881 1.119 5 2.5 5 Z" fill="rgb(31, 36, 33)" height="5px" id="EGcoD1_rr" transform="translate(6.875 4.531)" width="5.000015625000032px"/><path d="M 2.5 5 C 3.881 5 5 3.881 5 2.5 C 5 1.119 3.881 0 2.5 0 C 1.119 0 0 1.119 0 2.5 C 0 3.881 1.119 5 2.5 5 Z" fill="rgb(31, 36, 33)" height="5px" id="Rb1OgdUab" transform="translate(14.688 4.531)" width="5.000000000000071px"/><path d="M 2.5 5 C 3.881 5 5 3.881 5 2.5 C 5 1.119 3.881 0 2.5 0 C 1.119 0 0 1.119 0 2.5 C 0 3.881 1.119 5 2.5 5 Z" fill="rgb(31, 36, 33)" height="5px" id="F56g5TAbp" transform="translate(22.5 4.531)" width="5.000000000000071px"/><path d="M 10.574 31.093 L 38.699 31.093 C 41.392 31.093 43.976 30.023 45.88 28.119 C 47.785 26.214 48.855 23.631 48.855 20.937 C 48.855 18.243 47.785 15.66 45.88 13.755 C 43.976 11.851 41.392 10.781 38.699 10.781 C 38.011 7.915 36.44 5.338 34.208 3.413 C 31.976 1.488 29.196 0.313 26.261 0.054 C 23.325 -0.205 20.382 0.465 17.847 1.969 C 15.313 3.474 13.315 5.736 12.136 8.437 C 10.649 8.334 9.155 8.526 7.742 9 C 6.328 9.475 5.022 10.223 3.897 11.202 C 1.626 13.18 0.234 15.979 0.027 18.984 C -0.18 21.988 0.814 24.952 2.792 27.223 C 4.77 29.494 7.569 30.886 10.574 31.093 Z" fill="rgb(182, 194, 74)" height="31.093196941995256px" id="jLlCYyVFr" stroke-dasharray="" stroke-linecap="round" stroke-linejoin="round" stroke-width="3.44" stroke="rgb(31, 36, 33)" transform="translate(17.551 22.032)" width="48.85505395773247px"/><path d="M 0 3.906 L 5.469 9.375 L 14.844 0" fill="transparent" height="9.375px" id="ZWRct4GPm" stroke-dasharray="" stroke-linecap="round" stroke-linejoin="round" stroke-width="3.44" stroke="rgb(31, 36, 33)" transform="translate(35.156 38.281)" width="14.84375px"/><path d="M 0 9.375 L 12.5 9.375 M 12.5 9.375 L 25 9.375 M 12.5 9.375 L 12.5 0" fill="transparent" height="9.375px" id="C4xrp_qQu" stroke-dasharray="" stroke-linecap="round" stroke-linejoin="round" stroke-width="3.44" stroke="rgb(31, 36, 33)" transform="translate(29.688 65.625)" width="25px"/></g></svg>)
Works in any browser from head office or a building's management suite, nothing installed.
1
6
largest building activities ranked, from electricity to AC refrigerant
4
inventory areas per building: power and gas, heating and generator fuels, AC, vehicles
Request early access to be notified once electricity, gas and HVAC service figures can go in for every building you run.
A property manager answers an investor's portfolio survey
A real estate fund asks for Scope 1 and 2 emissions across eight office buildings. The property manager adds each as a location, types in a year of bills and HVAC reports, and sends per-building results with the portfolio total from the dashboard.
A facility manager checks a heat pump retrofit
After replacing a gas boiler with air-source heat pumps, the facility manager follows the building's gas and electricity items month by month. Boiler gas drops out of the ranking while electricity rises slightly, and the reduction target shows the net improvement.
A consultancy with three offices responds to a corporate client
A large client asks its suppliers for Scope 1 and 2 figures for its own supply-chain reporting. The office manager sets up three offices, enters electricity, heating and AC top-ups, and finds that an aging split system adds a noticeable share.
Why should an office building owner or occupier track carbon emissions?
Investors, lenders, corporate tenants and large clients now ask for Scope 1 and 2 figures per building, and energy performance increasingly affects lettings and property value. Tracking also exposes waste in heating, cooling and out-of-hours lighting. GHG Metric gives owners, managers and occupiers an easy way to build those figures building by building.
