


QUICK ANSWER
The easiest way for a small paper mill to track its carbon emissions is software that does the calculations for you. You list the mill's fuels and energy once, such as boiler gas, grid electricity and vehicle diesel, then type in monthly quantities from your bills. GHG Metric is built for mills measuring for the first time: no carbon jargon, GHG Protocol calculations.
01
Add your mill and pick what it uses: boiler fuels, grid electricity, vehicles and cooling equipment.
02
Type in each month's quantities from bills and delivery notes, in m³, kg, liters or kWh.
03
The software applies GHG Protocol emission factors and sorts each activity into Scope 1 or Scope 2.
04
Check the dashboard each month and start with the activity that emits the most.
01
Add your mill
Create your mill as a facility. A second mill or converting plant can be added later in a minute.
02
Pick what your mill uses
Choose the cards that apply: electricity and natural gas, boiler and dryer fuels, refrigeration equipment, and vehicles such as forklifts, yard loaders and delivery trucks.
03
Save recurring items as favorites
Name each meter or fuel once, such as "Boiler 1 natural gas" or "PM2 electricity". Pick its unit (m³, kg, liters or kWh) and star it.
04
Enter monthly figures, read results
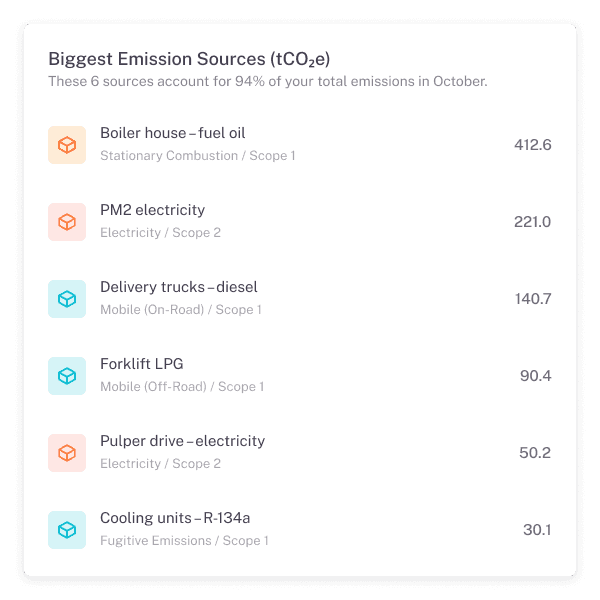
Type each month's quantity from bills and delivery notes. Totals, the monthly chart and your top-emitting activities update straight away.
Build your mill's inventory card by card: natural gas and fuel oil for the boilers, electricity for pulpers, refiners and paper machines, LPG for forklifts, diesel for yard loaders and trucks, and refrigerant top-ups for cooling units. You pick activities in plain terms. GHG Metric files each one under the right scope and applies the factor for its fuel and unit.

Pick Mill Activities, Not Scopes
Cover Boilers, Machines and Mill Vehicles
Enter m³, kg, Liters or kWh as Billed


" width="78.125px"><path d="M 10.938 0 L 0 23.438 M 14.063 0 L 25 23.438" fill="transparent" height="23.4375px" id="d8hM_8Qvd" stroke-dasharray="" stroke-linecap="round" stroke-linejoin="round" stroke-width="3.44" stroke="rgb(31, 36, 33)" transform="translate(26.563 53.125)" width="25px"/><path d="M 74.219 0 L 3.906 0 C 1.749 0 0 1.749 0 3.906 L 0 49.219 C 0 51.376 1.749 53.125 3.906 53.125 L 74.219 53.125 C 76.376 53.125 78.125 51.376 78.125 49.219 L 78.125 3.906 C 78.125 1.749 76.376 0 74.219 0 Z" fill="rgb(255, 255, 255)" height="53.125px" id="b15pfSmVJ" stroke-dasharray="" stroke-linecap="round" stroke-linejoin="round" stroke-width="3.44" stroke="rgb(31, 36, 33)" width="78.125px"/><path d="M 0 0 L 78.125 0" fill="transparent" height="1px" id="FFAkwVJUK" stroke-dasharray="" stroke-linecap="round" stroke-linejoin="round" stroke-width="3.44" stroke="rgb(31, 36, 33)" transform="translate(0 9.375)" width="78.125px"/><path d="M 7.813 0 L 0 0 L 0 15.625 L 7.813 15.625 Z" fill="rgb(182, 194, 74)" height="15.625px" id="EPBteug7h" stroke-dasharray="" stroke-linecap="round" stroke-linejoin="round" stroke-width="3.44" stroke="rgb(31, 36, 33)" transform="translate(10.938 29.688)" width="7.8125px"/><path d="M 7.813 0 L 0 0 L 0 25 L 7.813 25 Z" fill="rgb(182, 194, 74)" height="25px" id="fi8qSKkjx" stroke-dasharray="" stroke-linecap="round" stroke-linejoin="round" stroke-width="3.44" stroke="rgb(31, 36, 33)" transform="translate(23.438 20.313)" width="7.8125px"/><path d="M 7.813 0 L 0 0 L 0 20.313 L 7.813 20.313 Z" fill="rgb(233, 237, 201)" height="20.3125px" id="jRwaHT4bY" stroke-dasharray="" stroke-linecap="round" stroke-linejoin="round" stroke-width="3.44" stroke="rgb(31, 36, 33)" transform="translate(35.938 25)" width="7.8125px"/><path d="M 11.719 23.438 C 18.191 23.438 23.438 18.191 23.438 11.719 C 23.438 5.247 18.191 0 11.719 0 C 5.247 0 0 5.247 0 11.719 C 0 18.191 5.247 23.438 11.719 23.438 Z" fill="rgb(233, 237, 201)" height="23.4375px" id="F35cvS0QV" stroke-dasharray="" stroke-linecap="round" stroke-linejoin="round" stroke-width="3.44" stroke="rgb(31, 36, 33)" transform="translate(47.656 22.656)" width="23.4375px"/><path d="M 0 0 L 8.594 8.594" fill="transparent" height="8.59375px" id="D_Yi3CT3V" stroke-dasharray="" stroke-linecap="round" stroke-linejoin="round" stroke-width="3.44" stroke="rgb(31, 36, 33)" transform="translate(67.969 42.969)" width="8.59375px"/><path d="M 0 3.125 L 3.125 6.25 L 9.375 0" fill="transparent" height="6.25px" id="aogc524Gq" stroke-dasharray="" stroke-linecap="round" stroke-linejoin="round" stroke-width="3.44" stroke="rgb(31, 36, 33)" transform="translate(54.688 31.25)" width="9.375px"/></g></svg>)
See your mill's Scope 1 and 2 emissions in one monthly chart, ready for buyer questionnaires.
" width="81.25px"><path d="M 0 9.375 L 25 0 L 53.125 9.375 L 81.25 0 L 81.25 62.5 L 53.125 71.875 L 25 62.5 L 0 71.875 Z" fill="rgb(233, 237, 201)" height="71.875px" id="vSCZD949O" stroke-dasharray="" stroke-linecap="round" stroke-linejoin="round" stroke-width="3.44" stroke="rgb(31, 36, 33)" width="81.25px"/><path d="M 0 0 L 0 62.5 M 28.125 9.375 L 28.125 71.875" fill="transparent" height="71.875px" id="lXTzcQBES" stroke-dasharray="" stroke-linecap="round" stroke-linejoin="round" stroke-width="3.44" stroke="rgb(31, 36, 33)" transform="translate(25 0)" width="28.125px"/><path d="M 13.281 35.156 C 13.281 35.156 0 21.875 0 13.281 C 0 9.759 1.399 6.381 3.89 3.89 C 6.381 1.399 9.759 0 13.281 0 C 16.804 0 20.182 1.399 22.672 3.89 C 25.163 6.381 26.563 9.759 26.563 13.281 C 26.563 21.875 13.281 35.156 13.281 35.156 Z" fill="rgb(182, 194, 74)" height="35.15625px" id="yY3Oq8kmu" stroke-dasharray="" stroke-linecap="round" stroke-linejoin="round" stroke-width="3.44" stroke="rgb(31, 36, 33)" transform="translate(11.719 8.594)" width="26.5625px"/><path d="M 4.688 9.375 C 7.276 9.375 9.375 7.276 9.375 4.688 C 9.375 2.099 7.276 0 4.688 0 C 2.099 0 0 2.099 0 4.688 C 0 7.276 2.099 9.375 4.688 9.375 Z" fill="rgb(255, 255, 255)" height="9.375px" id="y9n93J6_D" stroke-dasharray="" stroke-linecap="round" stroke-linejoin="round" stroke-width="3.44" stroke="rgb(31, 36, 33)" transform="translate(20.313 17.188)" width="9.375px"/><path d="M 10.938 28.906 C 10.938 28.906 0 17.969 0 10.938 C 0 8.037 1.152 5.255 3.204 3.204 C 5.255 1.152 8.037 0 10.938 0 C 13.838 0 16.62 1.152 18.671 3.204 C 20.723 5.255 21.875 8.037 21.875 10.938 C 21.875 17.969 10.938 28.906 10.938 28.906 Z" fill="rgb(255, 255, 255)" height="28.90625px" id="sDOsahOwu" stroke-dasharray="" stroke-linecap="round" stroke-linejoin="round" stroke-width="3.44" stroke="rgb(31, 36, 33)" transform="translate(48.438 24.219)" width="21.875px"/><path d="M 3.75 7.5 C 5.821 7.5 7.5 5.821 7.5 3.75 C 7.5 1.679 5.821 0 3.75 0 C 1.679 0 0 1.679 0 3.75 C 0 5.821 1.679 7.5 3.75 7.5 Z" fill="rgb(182, 194, 74)" height="7.5px" id="y2KnbfKez" stroke-dasharray="" stroke-linecap="round" stroke-linejoin="round" stroke-width="3.44" stroke="rgb(31, 36, 33)" transform="translate(55.625 31.406)" width="7.49999999999973px"/></g></svg>)
Add a second mill, converting plant or warehouse and see results per site and in total.
" width="82.8125px"><path d="M 32.813 65.625 C 50.934 65.625 65.625 50.934 65.625 32.813 C 65.625 14.691 50.934 0 32.813 0 C 14.691 0 0 14.691 0 32.813 C 0 50.934 14.691 65.625 32.813 65.625 Z" fill="rgb(255, 255, 255)" height="65.625px" id="xeBB4d1Gb" stroke-dasharray="" stroke-linecap="round" stroke-linejoin="round" stroke-width="3.44" stroke="rgb(31, 36, 33)" transform="translate(0 17.188)" width="65.625px"/><path d="M 21.875 43.75 C 33.956 43.75 43.75 33.956 43.75 21.875 C 43.75 9.794 33.956 0 21.875 0 C 9.794 0 0 9.794 0 21.875 C 0 33.956 9.794 43.75 21.875 43.75 Z" fill="rgb(182, 194, 74)" height="43.75px" id="mtshUSx75" stroke-dasharray="" stroke-linecap="round" stroke-linejoin="round" stroke-width="3.44" stroke="rgb(31, 36, 33)" transform="translate(10.938 28.125)" width="43.75px"/><path d="M 10.938 21.875 C 16.978 21.875 21.875 16.978 21.875 10.938 C 21.875 4.897 16.978 0 10.938 0 C 4.897 0 0 4.897 0 10.938 C 0 16.978 4.897 21.875 10.938 21.875 Z" fill="rgb(255, 255, 255)" height="21.875px" id="mL14m5PXF" stroke-dasharray="" stroke-linecap="round" stroke-linejoin="round" stroke-width="3.44" stroke="rgb(31, 36, 33)" transform="translate(21.875 39.063)" width="21.875px"/><path d="M 3.125 6.25 C 4.851 6.25 6.25 4.851 6.25 3.125 C 6.25 1.399 4.851 0 3.125 0 C 1.399 0 0 1.399 0 3.125 C 0 4.851 1.399 6.25 3.125 6.25 Z" fill="rgb(31, 36, 33)" height="6.25px" id="HxN2RQi1k" transform="translate(29.688 46.875)" width="6.25px"/><path d="M 0 34.375 L 34.375 0" fill="transparent" height="34.375px" id="iTd92BZ7t" stroke-dasharray="" stroke-linecap="round" stroke-linejoin="round" stroke-width="3.44" stroke="rgb(31, 36, 33)" transform="translate(32.813 15.625)" width="34.375px"/><path d="M 0 15.625 L 0 3.125 L 9.375 0 L 6.25 9.375 L 15.625 9.375 L 12.5 15.625 Z" fill="rgb(233, 237, 201)" height="15.625px" id="w79rFToGO" stroke-dasharray="" stroke-linecap="round" stroke-linejoin="round" stroke-width="3.44" stroke="rgb(31, 36, 33)" transform="translate(67.188 0)" width="15.625px"/></g></svg>)
Set a target for your mill and follow progress month by month.
" width="67.1875px"><path d="M 48.438 0 L 4.688 0 C 2.099 0 0 2.099 0 4.688 L 0 70.313 C 0 72.901 2.099 75 4.688 75 L 48.438 75 C 51.026 75 53.125 72.901 53.125 70.313 L 53.125 4.688 C 53.125 2.099 51.026 0 48.438 0 Z" fill="rgb(255, 255, 255)" height="75px" id="y5hxB6X2h" stroke-dasharray="" stroke-linecap="round" stroke-linejoin="round" stroke-width="3.44" stroke="rgb(31, 36, 33)" width="53.125px"/><path d="M 7.813 0 L 1.563 0 C 0.7 0 0 0.7 0 1.563 L 0 7.813 C 0 8.675 0.7 9.375 1.563 9.375 L 7.813 9.375 C 8.675 9.375 9.375 8.675 9.375 7.813 L 9.375 1.563 C 9.375 0.7 8.675 0 7.813 0 Z" fill="rgb(182, 194, 74)" height="9.375px" id="RupO7lKF1" stroke-dasharray="" stroke-linecap="round" stroke-linejoin="round" stroke-width="3.44" stroke="rgb(31, 36, 33)" transform="translate(9.375 12.5)" width="9.375px"/><path d="M 0 0 L 17.188 0" fill="transparent" height="1px" id="P20hSjC8k" stroke-dasharray="" stroke-linecap="round" stroke-linejoin="round" stroke-width="3.44" stroke="rgb(31, 36, 33)" transform="translate(26.563 17.188)" width="17.1875px"/><path d="M 7.813 0 L 1.563 0 C 0.7 0 0 0.7 0 1.563 L 0 7.813 C 0 8.675 0.7 9.375 1.563 9.375 L 7.813 9.375 C 8.675 9.375 9.375 8.675 9.375 7.813 L 9.375 1.563 C 9.375 0.7 8.675 0 7.813 0 Z" fill="rgb(182, 194, 74)" height="9.375px" id="xTAFTlBf1" stroke-dasharray="" stroke-linecap="round" stroke-linejoin="round" stroke-width="3.44" stroke="rgb(31, 36, 33)" transform="translate(9.375 29.688)" width="9.375px"/><path d="M 0 0 L 17.188 0" fill="transparent" height="1px" id="WUTeDm5Oo" stroke-dasharray="" stroke-linecap="round" stroke-linejoin="round" stroke-width="3.44" stroke="rgb(31, 36, 33)" transform="translate(26.563 34.375)" width="17.1875px"/><path d="M 7.813 0 L 1.563 0 C 0.7 0 0 0.7 0 1.563 L 0 7.813 C 0 8.675 0.7 9.375 1.563 9.375 L 7.813 9.375 C 8.675 9.375 9.375 8.675 9.375 7.813 L 9.375 1.563 C 9.375 0.7 8.675 0 7.813 0 Z" fill="rgb(233, 237, 201)" height="9.375px" id="JRrWC58rl" stroke-dasharray="" stroke-linecap="round" stroke-linejoin="round" stroke-width="3.44" stroke="rgb(31, 36, 33)" transform="translate(9.375 46.875)" width="9.375px"/><path d="M 0 0 L 9.375 0" fill="transparent" height="1px" id="mXsqmo7HQ" stroke-dasharray="" stroke-linecap="round" stroke-linejoin="round" stroke-width="3.44" stroke="rgb(31, 36, 33)" transform="translate(26.563 51.563)" width="9.375px"/><path d="M 4.688 0 L 0 15.625 L 7.813 11.719 L 12.5 17.188 L 15.625 3.125" fill="rgb(233, 237, 201)" height="17.1875px" id="DrnswayXi" stroke-dasharray="" stroke-linecap="round" stroke-linejoin="round" stroke-width="3.44" stroke="rgb(31, 36, 33)" transform="translate(40.625 70.313)" width="15.625px"/><path d="M 7.813 0 L 12.5 15.625 L 4.688 11.719 L 0 17.188" fill="rgb(233, 237, 201)" height="17.1875px" id="evMmjs7h2" stroke-dasharray="" stroke-linecap="round" stroke-linejoin="round" stroke-width="3.44" stroke="rgb(31, 36, 33)" transform="translate(53.125 70.313)" width="12.5px"/><path d="M 14.063 28.125 C 21.829 28.125 28.125 21.829 28.125 14.063 C 28.125 6.296 21.829 0 14.063 0 C 6.296 0 0 6.296 0 14.063 C 0 21.829 6.296 28.125 14.063 28.125 Z" fill="rgb(182, 194, 74)" height="28.125px" id="BBxTX78kF" stroke-dasharray="" stroke-linecap="round" stroke-linejoin="round" stroke-width="3.44" stroke="rgb(31, 36, 33)" transform="translate(39.063 48.438)" width="28.125px"/><path d="M 0 3.906 L 3.906 7.813 L 10.938 0" fill="transparent" height="7.8125px" id="oyOVGjMH2" stroke-dasharray="" stroke-linecap="round" stroke-linejoin="round" stroke-width="3.44" stroke="rgb(31, 36, 33)" transform="translate(47.656 58.594)" width="10.9375px"/></g></svg>)
Emission factors for every boiler fuel and unit, aligned with the GHG Protocol.
" width="87.5px"><path d="M 7.813 15.625 C 12.127 15.625 15.625 12.127 15.625 7.813 C 15.625 3.498 12.127 0 7.813 0 C 3.498 0 0 3.498 0 7.813 C 0 12.127 3.498 15.625 7.813 15.625 Z" fill="rgb(255, 255, 255)" height="15.625px" id="brxrqZ3T2" stroke-dasharray="" stroke-linecap="round" stroke-linejoin="round" stroke-width="3.44" stroke="rgb(31, 36, 33)" transform="translate(6.25 11.719)" width="15.625px"/><path d="M 0 10.547 C 0 -3.516 28.125 -3.516 28.125 10.547 Z" fill="rgb(255, 255, 255)" height="10.546875px" id="YKfXNhH0n" stroke-dasharray="" stroke-linecap="round" stroke-linejoin="round" stroke-width="3.44" stroke="rgb(31, 36, 33)" transform="translate(0 41.797)" width="28.125px"/><path d="M 7.813 15.625 C 12.127 15.625 15.625 12.127 15.625 7.813 C 15.625 3.498 12.127 0 7.813 0 C 3.498 0 0 3.498 0 7.813 C 0 12.127 3.498 15.625 7.813 15.625 Z" fill="rgb(255, 255, 255)" height="15.625px" id="c_XMbm3Tl" stroke-dasharray="" stroke-linecap="round" stroke-linejoin="round" stroke-width="3.44" stroke="rgb(31, 36, 33)" transform="translate(65.625 11.719)" width="15.625px"/><path d="M 0 10.547 C 0 -3.516 28.125 -3.516 28.125 10.547 Z" fill="rgb(255, 255, 255)" height="10.546875px" id="dRZK4YGgr" stroke-dasharray="" stroke-linecap="round" stroke-linejoin="round" stroke-width="3.44" stroke="rgb(31, 36, 33)" transform="translate(59.375 41.797)" width="28.125px"/><path d="M 11.719 23.438 C 18.191 23.438 23.438 18.191 23.438 11.719 C 23.438 5.247 18.191 0 11.719 0 C 5.247 0 0 5.247 0 11.719 C 0 18.191 5.247 23.438 11.719 23.438 Z" fill="rgb(182, 194, 74)" height="23.4375px" id="KcPEx6vmW" stroke-dasharray="" stroke-linecap="round" stroke-linejoin="round" stroke-width="3.44" stroke="rgb(31, 36, 33)" transform="translate(32.031 0)" width="23.4375px"/><path d="M 0 17.578 C 0 -5.859 43.75 -5.859 43.75 17.578 Z" fill="rgb(182, 194, 74)" height="17.578125px" id="teinitMbp" stroke-dasharray="" stroke-linecap="round" stroke-linejoin="round" stroke-width="3.44" stroke="rgb(31, 36, 33)" transform="translate(21.875 41.016)" width="43.75px"/></g></svg>)
Energy, maintenance and finance staff enter their own data with role-based permissions.
" width="84.375px"><path d="M 79.688 0 L 4.688 0 C 2.099 0 0 2.099 0 4.688 L 0 60.938 C 0 63.526 2.099 65.625 4.688 65.625 L 79.688 65.625 C 82.276 65.625 84.375 63.526 84.375 60.938 L 84.375 4.688 C 84.375 2.099 82.276 0 79.688 0 Z" fill="rgb(255, 255, 255)" height="65.625px" id="RXhyIcNiS" stroke-dasharray="" stroke-linecap="round" stroke-linejoin="round" stroke-width="3.44" stroke="rgb(31, 36, 33)" width="84.375px"/><path d="M 0 0 L 84.375 0" fill="transparent" height="1px" id="yfEzFetRq" stroke-dasharray="" stroke-linecap="round" stroke-linejoin="round" stroke-width="3.44" stroke="rgb(31, 36, 33)" transform="translate(0 14.063)" width="84.375px"/><path d="M 78.906 0 L 3.906 0 C 1.749 0 0 1.749 0 3.906 L 0 8.594 C 0 10.751 1.749 12.5 3.906 12.5 L 78.906 12.5 C 81.064 12.5 82.813 10.751 82.813 8.594 L 82.813 3.906 C 82.813 1.749 81.064 0 78.906 0 Z" fill="rgb(233, 237, 201)" height="12.5px" id="tbr6T5A1x" transform="translate(0.781 0.781)" width="82.8125px"/><path d="M 0 0 L 84.375 0" fill="transparent" height="1px" id="oR8ovSgA0" stroke-dasharray="" stroke-linecap="round" stroke-linejoin="round" stroke-width="3.44" stroke="rgb(31, 36, 33)" transform="translate(0 14.063)" width="84.375px"/><path d="M 2.5 5 C 3.881 5 5 3.881 5 2.5 C 5 1.119 3.881 0 2.5 0 C 1.119 0 0 1.119 0 2.5 C 0 3.881 1.119 5 2.5 5 Z" fill="rgb(31, 36, 33)" height="5px" id="EGcoD1_rr" transform="translate(6.875 4.531)" width="5.000015625000032px"/><path d="M 2.5 5 C 3.881 5 5 3.881 5 2.5 C 5 1.119 3.881 0 2.5 0 C 1.119 0 0 1.119 0 2.5 C 0 3.881 1.119 5 2.5 5 Z" fill="rgb(31, 36, 33)" height="5px" id="Rb1OgdUab" transform="translate(14.688 4.531)" width="5.000000000000071px"/><path d="M 2.5 5 C 3.881 5 5 3.881 5 2.5 C 5 1.119 3.881 0 2.5 0 C 1.119 0 0 1.119 0 2.5 C 0 3.881 1.119 5 2.5 5 Z" fill="rgb(31, 36, 33)" height="5px" id="F56g5TAbp" transform="translate(22.5 4.531)" width="5.000000000000071px"/><path d="M 10.574 31.093 L 38.699 31.093 C 41.392 31.093 43.976 30.023 45.88 28.119 C 47.785 26.214 48.855 23.631 48.855 20.937 C 48.855 18.243 47.785 15.66 45.88 13.755 C 43.976 11.851 41.392 10.781 38.699 10.781 C 38.011 7.915 36.44 5.338 34.208 3.413 C 31.976 1.488 29.196 0.313 26.261 0.054 C 23.325 -0.205 20.382 0.465 17.847 1.969 C 15.313 3.474 13.315 5.736 12.136 8.437 C 10.649 8.334 9.155 8.526 7.742 9 C 6.328 9.475 5.022 10.223 3.897 11.202 C 1.626 13.18 0.234 15.979 0.027 18.984 C -0.18 21.988 0.814 24.952 2.792 27.223 C 4.77 29.494 7.569 30.886 10.574 31.093 Z" fill="rgb(182, 194, 74)" height="31.093196941995256px" id="jLlCYyVFr" stroke-dasharray="" stroke-linecap="round" stroke-linejoin="round" stroke-width="3.44" stroke="rgb(31, 36, 33)" transform="translate(17.551 22.032)" width="48.85505395773247px"/><path d="M 0 3.906 L 5.469 9.375 L 14.844 0" fill="transparent" height="9.375px" id="ZWRct4GPm" stroke-dasharray="" stroke-linecap="round" stroke-linejoin="round" stroke-width="3.44" stroke="rgb(31, 36, 33)" transform="translate(35.156 38.281)" width="14.84375px"/><path d="M 0 9.375 L 12.5 9.375 M 12.5 9.375 L 25 9.375 M 12.5 9.375 L 12.5 0" fill="transparent" height="9.375px" id="C4xrp_qQu" stroke-dasharray="" stroke-linecap="round" stroke-linejoin="round" stroke-width="3.44" stroke="rgb(31, 36, 33)" transform="translate(29.688 65.625)" width="25px"/></g></svg>)
Enter data from the mill office or the shop floor in any browser, with nothing to install.
4
6
largest mill activities ranked on your dashboard
2
scopes per mill: boiler and vehicle fuel (Scope 1), power and steam (Scope 2)
Join the waitlist and we'll email you when you can add your boilers, paper machines and yard vehicles and see them ranked by emissions.
A mill manager gets a packaging buyer's questionnaire
A consumer goods customer asks a corrugated mill for emissions per ton of board. The mill manager enters a year of gas, power and diesel data, adds production tons and sends the Scope 1 and 2 breakdown from the dashboard.
A board mill exporting to Europe gets a CSRD request
A European packaging customer asks its board supplier for emissions with a clear method. The sales manager builds the inventory, closes the missing months in the status grid and sends the breakdown the buyer can use in its own supply-chain disclosure.
An owner cuts the biggest source first
The top-activities ranking shows fuel oil in the boiler house at almost half the total. The owner switches Boiler 2 to natural gas and compares that favorite item month by month to confirm the drop.
Why should a paper mill track its carbon emissions?
Packaging buyers, consumer goods brands and banks increasingly ask paper mills for Scope 1 and 2 figures before signing contracts or loans, and a mill without numbers can lose the tender. Tracking also shows where fuel and power are wasted, because a mill's emissions follow its energy use closely. GHG Metric is carbon tracking software that works for mills with a sustainability team and for those measuring for the first time.
